k6 is a powerful open-source tool that offers robust reporting capabilities. One of its strengths is the ability to enhance performance reports and convert them into various formats based on your specific needs. Depending on the requirement/preference, ways to export include CSV, JSON, or even sending them directly to the cloud. In this blog post, I will go over the rich set of metrics provided by k6 and explore these features in detail.
This is the third post in our performance testing series. If you are new to performance testing, you can learn more about why performance testing matters, and you can find out about the basics of K6 in the second post.
Explaining Metrics
After performing tests, understanding the reports is an important step. k6 offers a rich set of metrics as a report that helps provide insights into performance at the protocol-level and browser-level. Details about response times, throughput, error rates, and many other relevant metrics offer a detailed understanding of how the system behaves. First, I will look at the metrics in the protocol-level, and in the next blog post, I will go over browser specific metrics.
data_received..................: 823 kB 27 kB/s
     data_sent......................: 102 kB 3.4 kB/s
     http_req_blocked...............: avg=2.45ms   min=0s       med=1µs      max=549.97ms p(90)=2µs      p(95)=2µs
     http_req_connecting............: avg=635.74µs min=0s       med=0s       max=138.95ms p(90)=0s       p(95)=0s
     http_req_duration..............: avg=138.37ms min=133.07ms med=138.43ms max=187.68ms p(90)=140.87ms p(95)=142.4ms
       { expected_response:true }...: avg=138.37ms min=133.07ms med=138.43ms max=187.68ms p(90)=140.87ms p(95)=142.4ms
     http_req_failed................: 0.00%  ✓ 0         ✗ 2132
     http_req_receiving.............: avg=119.57µs min=8µs      med=63µs     max=2.97ms   p(90)=134µs    p(95)=707.69µs
     http_req_sending...............: avg=83.91µs  min=13µs     med=79µs     max=2.56ms   p(90)=119µs    p(95)=137.44µs
     http_req_tls_handshaking.......: avg=1.61ms   min=0s       med=0s       max=370.14ms p(90)=0s       p(95)=0s
     http_req_waiting...............: avg=138.16ms min=132.89ms med=138.26ms max=187.55ms p(90)=140.69ms p(95)=142.12ms
     http_reqs......................: 2132   70.735814/s
     iteration_duration.............: avg=140.97ms min=133.11ms med=138.56ms max=690.81ms p(90)=141.08ms p(95)=143.11ms
     iterations.....................: 2132   70.735814/s
     vus............................: 10     min=10      max=10
     vus_max........................: 10     min=10      max=10
- data_received: The amount of data received.
- data_sent: The amount of data sent.
- http_req_blocked: The amount of time requests were blocked before starting. This metric indicates delays before the request is sent, which can include time taken for setting up a network connection or waiting due to prior requests.
- http_req_connecting: Time spent establishing a TCP connection. It specifically measures the time taken to establish a TCP connection between the test machine and the server.
- http_req_duration: Duration of HTTP requests. This metric measures the time it takes from initiating an HTTP request to when the response is fully received.
- http_req_failed: Percentage of the requests that failed due to errors. This is helpful to see how many requests were unsuccessful during the test.
- http_req_receiving: Time spent receiving the HTTP response. This measures the duration of receiving the response data from the server.
- http_req_sending: Time spent sending the HTTP request. This includes the time taken to send all the HTTP request data to the server, including headers and body.
- http_req_tls_handshaking: Time spent in TLS/SSL handshaking. This metric reports the duration of the cryptographic handshake process used to establish a secure communication channel.
- http_req_waiting: Time spent waiting for a response from the server. This is often the largest portion of the request duration and measures the time from the end of sending the request to the beginning of receiving the response.
- http_reqs: Total number of HTTP requests. This metric represents the total number of HTTP requests made during the test.
- iteration_duration: Total time taken for one complete iteration of the test script, including setups and teardowns. This reflects the time from the start to the end of each user scenario executed.
- vus: Number of virtual users. This metric shows the number of concurrent virtual users active at any point during the test.
- vus_max: Maximum number of virtual users. This indicates the peak number of virtual users that were active during the test. This helps in understanding the scale of the test.Adding Specific Metrics
I have mentioned that k6 already has a rich set of metrics. However, in some cases, you may need to add custom metrics. This allows you to measure details about system behavior that might be critical for certain test scenarios. In this way, you can even get some deeper insights about your system's performance.
In the following example, you can see custom-added metrics using Trend, Rate, and Counter. You can refer to the k6 documentation to get more information about k6/metrics module.
import {Trend, Rate, Counter} from 'k6/metrics';
Trend is used to track the trend of the benchmark over a certain period of time. In the example, I added a metric called ‘customTrend’ that tracks the waiting time of the request defined with the ‘custom_waiting_time’ variable (this name represents the name that will appear in the report).
const customTrend = new Trend('custom_waiting_time');
customTrend.add(response.timings.waiting);
Rate is used to track the ratio of a particular event to total events. In the example, I added a metric called ‘failureRate’, which shows the ratio of failed requests to total requests, defined with the ‘custom_failure_rate’ variable (this name represents the name that will appear in the report).
const failureRate = new Rate('custom_failure_rate');
failureRate.add(response.status !== 200);
Counter is used to track how many times a particular event occurs. In the example, I added a metric called ‘requestCount’ that shows the number of requests with the ‘custom_request_count’ variable (this name represents the name that will appear in the report).
const requestCount = new Counter('custom_request_count');
 requestCount.add(1);
The final version of the script is as follows:
import http from 'k6/http';
import {Trend, Rate, Counter} from 'k6/metrics';

export const options = {
   vus: 3,
   duration: '5s'
};

const customTrend = new Trend('custom_waiting_time');
const requestCount = new Counter('custom_request_count');
const failureRate = new Rate('custom_failure_rate');

export default function () {
   const url = 'https://petstore.swagger.io/v2/store/inventory'
   const header = {
       headers: {accept: 'application/json'}
   }
   const response = http.get(url, header);
   customTrend.add(response.timings.waiting);
   requestCount.add(1);
   failureRate.add(response.status !== 200);
}
custom_failure_rate............: 0.00%  ✓ 0         ✗ 100
     custom_request_count...........: 100    19.635491/s
     custom_waiting_time............: avg=137.43243 min=134.138  med=137.5885 max=143.734  p(90)=139.3735 p(95)=139.93505
     data_received..................: 56 kB  11 kB/s
     data_sent......................: 6.4 kB 1.2 kB/s
     http_req_blocked...............: avg=13.87ms   min=0s       med=1µs      max=464.79ms p(90)=2µs      p(95)=3.04µs
     http_req_connecting............: avg=4.02ms    min=0s       med=0s       max=135.71ms p(90)=0s       p(95)=0s
     http_req_duration..............: avg=137.68ms  min=134.34ms med=137.88ms max=143.84ms p(90)=139.55ms p(95)=140.1ms
       { expected_response:true }...: avg=137.68ms  min=134.34ms med=137.88ms max=143.84ms p(90)=139.55ms p(95)=140.1ms
     http_req_failed................: 0.00%  ✓ 0         ✗ 100
     http_req_receiving.............: avg=108.75µs  min=14µs     med=100.5µs  max=842µs    p(90)=134.1µs  p(95)=155.94µs
     http_req_sending...............: avg=143.84µs  min=23µs     med=109.5µs  max=2.27ms   p(90)=158.29µs p(95)=186.49µs
     http_req_tls_handshaking.......: avg=9.09ms    min=0s       med=0s       max=305ms    p(90)=0s       p(95)=0s
     http_req_waiting...............: avg=137.43ms  min=134.13ms med=137.58ms max=143.73ms p(90)=139.37ms p(95)=139.93ms
     http_reqs......................: 100    19.635491/s
     iteration_duration.............: avg=151.8ms   min=134.61ms med=138.2ms  max=603.24ms p(90)=140.1ms  p(95)=141.72ms
     iterations.....................: 100    19.635491/s
     vus............................: 3      min=3       max=3
     vus_max........................: 3      min=3       max=3
Different Output
As you can see in the examples above, k6 reports are output as terminal output on the local machine. When you want to share these reports with your teammates, k6’s flexible structure allows you to create reports in the format you need.
To receive reports in JSON format, it will be sufficient to add –out json=reportname.json to the run command. With this command, a JSON report with the desired name will be created at the root level of the project.
k6 run --out json=results.json check.js
For report outputs in CSV format, it will be sufficient to follow the same way as JSON.
k6 run --out csv=results.csv check.js
Apart from this, k6 v0.49.0 provides a web dashboard feature that allows for real-time monitoring. When you run the tests and set the K6_WEB_DASHBOARD environment variable to true, you will be able to see the results in real-time on the dashboard.
K6_WEB_DASHBOARD=true k6 run check.js
After running this command, you can access the URL for the web dashboard from the terminal.
          /\      |‾‾| /‾‾/   /‾‾/
     /\  /  \     |  |/  /   /  /
    /  \/    \    |     (   /   ‾‾\
   /          \   |  |\  \ |  (‾)  |
  / __________ \  |__| \__\ \_____/ .io

     execution: local
        script: scripts/thresholds.js
 web dashboard: http://127.0.0.1:5665
        output: -

     scenarios: (100.00%) 1 scenario, 10 max VUs, 1m30s max duration (incl. graceful stop):
              * default: 10 looping VUs for 1m0s (gracefulStop: 30s)
You can access the environment variables with which you can configure the web dashboard and the default values of these variables here. Web dashboard consists of 3 tabs, Overview, Timings and Summary.
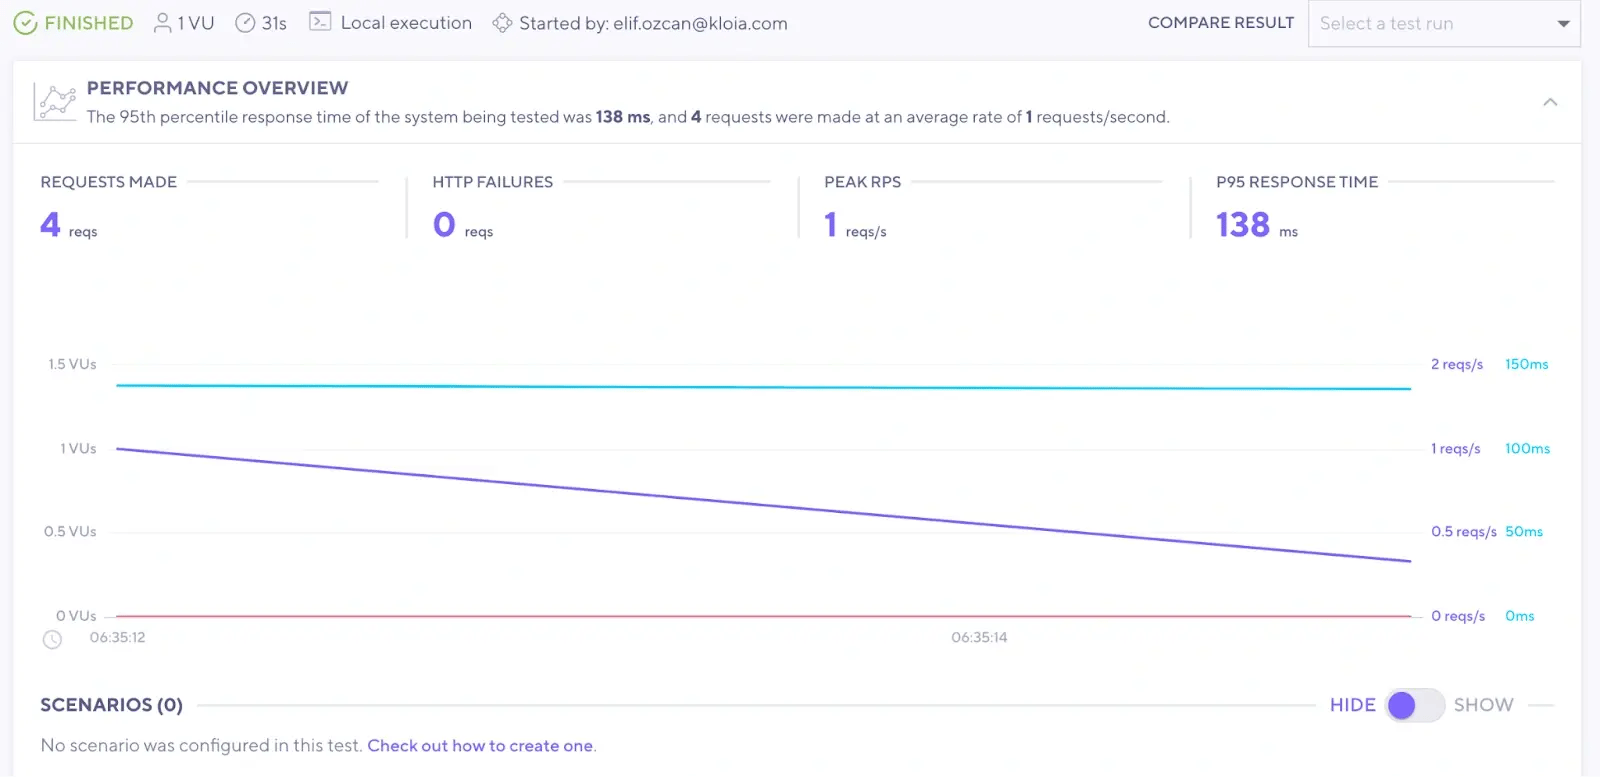
Overview
The overview tab provides a high-level summary of the test execution. It contains metrics such as the total number of requests, average response time. This part also includes a trend chart that shows performance over time during the test run.

Timings
The timings tab provides detailed timing metrics for various aspects of the test. This detailed timing analysis helps in identifying specific problems in network or server activities.

Summary
The summary tab shows the key results of the test in a simple format. It presents aggregated metrics such as the total number of requests, the number of failed requests, and response time distribution metrics(percentiles). This part provides a quick snapshot of the overall performance.

You can obtain the report containing these results by clicking the report button at the top right of the page.
Also, you can generate the same report at the root level of the project by specifying it through the K6_WEB_DASHBOARD_EXPORT environment variable.
K6_WEB_DASHBOARD=true K6_WEB_DASHBOARD_EXPORT=report.html k6 run check.js
The steps I have to take to get the reports in HTML format are a bit more than JSON or CSV. You can completely customize the output with k6 handleSummary(). In this example, I will proceed with an example of creating an HTML report using the k6 HTML Report Exporter v2 extension.

import { htmlReport } from "https://raw.githubusercontent.com/benc-uk/k6-reporter/main/dist/bundle.js";
After importing this extension, I create a function that will use handleSummary().
export function handleSummary(data) {
   console.log('Preparing the end-of-test summary...');
   return {
       'test-summary-report.html': htmlReport(data),
   };
}
After running the script, an HTML file named test-summary-report is created at the root level of my project, as I specified in the handleSummary function.

When you open this resulting HTML with your browser, you will see a report consisting of 3 tabs (Request Metrics, Other Stats, Checks & Groups) as in the example below.


Cloud Output
With k6, you can run the tests locally and store the results in the cloud. k6 has many options in this regard, you can examine the options in the stream to service list.
Let's examine the Cloud in this list with a simple example. k6 Cloud offers the opportunity to run these tests in the cloud as well as store the test results in the cloud.
After completing the registration process, you can use the token you have and upload your results to the cloud and see them.
K6_CLOUD_TOKEN= k6 run --out cloud script.js

k6 Cloud has a powerful and customizable dashboard. It is possible to create customizable charts to compare and analyze metrics with a single click. While it can keep all reports historical, it offers the opportunity to compare between these reports. Comparing the reports throughout the process is already part of the process, but this can be done very easily thanks to this UI.
Conclusion
k6's ability to develop and customize reports is one of its most powerful features.
- Rich set of metrics: k6 provides a rich set of metrics, and you can gain valuable insights into various aspects of your system’s performance.
- Custom-added metrics: k6 allows you to add custom metrics to track specific aspects of your system.
- Flexible output formats: k6 offers flexible output formats such as CSV, JSON, and HTML, making it easy to share and analyze reports.
- Real-time monitoring with web-dashboard: k6 provides its own web dashboard, which has a real-time monitoring feature without the need for additional tools. This intuitive interface allows you to visualize and analyze performance data as it's being generated, enabling rapid identification and resolution of performance bottlenecks.
- Easily stream metrics: k6 can easily stream metrics to various external systems such as InfluxDB, Prometheus, k6 Cloud, and more, allowing for easy integration with your existing monitoring infrastructure.This integration ensures that your performance data is readily available within your preferred monitoring and analysis tools.